Station 4 Fire Protection Cost Analysis
| Version | Date | Description |
|---|---|---|
| 1.0 | February 18, 2026 | Initial publication. |
| 1.1 | February 28, 2026 | Updated Boulder Rural benchmark inputs to reflect clarified 2026 staffing and budget presentation. |
What This Model Is — and What It Is Not
This model does:
- Test whether Zone 4 revenue can sustain service-level staffing, station operations, and capital lifecycle reserves under different administrative cost structures.
- Use publicly available and independently verifiable budget data as the basis for all benchmarks.
- Disclose all estimation methods, assumptions, and limitations transparently.
This model does NOT:
- Make claims about cross-subsidy, misallocation, or “who pays for whom”; it simply models how Zone 4 revenue compares to verifiable unit-cost benchmarks under pooled district budgeting.
- Prescribe exclusion from, or annexation into, any fire protection district.
- Determine the correct staffing level for Station 4.
- Estimate one-time transition costs associated with any administrative change.
- Constitute a policy proposal or recommendation for immediate action.
I. Executive Summary
Key takeaway: Based on 2026 adopted budgets, Zone 4 tax-base revenue, when modeled against verifiable unit-cost benchmarks, is sufficient to cover fully-loaded station costs—including staffing, operations, and capital lifecycle reserves—at modeled staffing levels of 15 FTEs or fewer. At 18 FTEs, two of three benchmarks remain positive; at 21 FTEs, all three produce negative net positions. Fiscal outcomes are driven by differences in per-FTE labor cost, administrative allocation, and station operating cost assumptions.
Because fire districts classify station-level operating costs differently, this analysis treats “Station OpEx” as a bounded sensitivity variable rather than asserting a single definitive station cost. Results are presented across a defensible range of operating cost assumptions to test revenue sufficiency under multiple plausible cost structures. Where districts use storage/support facilities in addition to a primary staffed station, those facilities do not change the benchmark approach here; the key comparison is how adopted budgets classify non-personnel operating costs, not how many buildings exist.
This document models Station 4 / Zone 4 costs using unit-cost benchmarks derived from the Mountain View 2026 Budget Book and the Boulder Rural 2026 Adopted Budget. The analysis is structured so that any corrected or updated inputs (e.g., revised FTE counts, updated revenue totals, or clarified station accounting) can be substituted without altering the underlying methodology.
Scope: The analysis is limited to Station 4 / Zone 4. According to MVFR planning materials, Station 4 is configured as a “heavy station” staffing both an engine company and a transporting ambulance on a 24/7 basis.
Service-Level Assumption: All scenarios assume no degradation in current service levels. Staffing configurations range from 12 to 21 FTEs. This model does not determine the correct staffing level; that determination requires an independent staffing study (see Section VIII).
Methodology: All figures can be independently verified against the cited page numbers. Mountain View figures are taken from the District’s 2026 Budget Book (board packet / hard-copy distribution); page references are provided for verification against that document. Both districts’ 2026 budgets contain one-time elements (Mountain View: retroactive wage adjustment; Boulder Rural: reserve transfer to balance expenditures); benchmarks reflect adopted 2026 levels and should be interpreted accordingly.
Finding: Structural cost differences appear in the adopted 2026 budgets of the two districts in per-FTE labor cost, administrative allocation, and station-level operating expense. When applied to Zone 4 revenue, these structural differences produce materially different fiscal outcomes across equivalent staffing levels. Under all modeled scenarios at 15 FTEs or fewer, Zone 4 revenue is sufficient to cover localized station operating costs, with remaining revenue allocated to district-wide administrative functions, capital programs, reserves, and system-wide coverage. At 18 FTEs, the Boulder Rural benchmark (Scenario 2) produces a negative net position due to its higher adopted non-personnel operating subtotal (as presented in the Boulder Rural budget), while the Mountain View and Hybrid models remain positive. At 21 FTEs, all three scenarios produce negative net positions.
Public statements indicate that Station 4 annual staffing costs are around $2.5 million and exclude maintenance expenses (LHVC, Feb. 4, 2026; public estimate, not audited station accounting). Using this model’s fully-loaded labor benchmark of $201,719 per FTE, $2.5 million corresponds to approximately 12 fully-loaded FTEs—aligning closely with the model’s 12 FTE scenario. At that staffing level, even after accounting for fully-loaded labor, administrative overhead, station operations, and a $500,000 annual capital lifecycle reserve, all three scenarios produce net positions ranging from $1.21 million to $1.99 million. That is, under the district’s own publicly stated staffing-cost figure, Zone 4 revenue appears sufficient to sustain current service levels across a range of defensible cost structures, with net positions of $1.2–$2.0 million, which in a pooled district budget would typically be applied to shared administration, capital programs, reserves, and system-wide coverage.
Purpose: This document is a cost model, not a policy proposal. It is published to inform public discussion. No immediate change in fire service administration is proposed or implied.
II. Revenue Context
II.A. Revenue Derivation Methodology, Sources, and Limitations
Because Station 4 / Zone 4 is not a separately reported fiscal entity within Mountain View Fire Protection District (MVFR), certain revenue components must be derived or estimated. This analysis distinguishes between (a) revenues that can be reproduced mechanically from assessor/budget inputs, and (b) revenues that must be allocated or bounded due to the absence of station-level reporting in district budgets.
Confidence Classification (Reader Guide):
- High confidence Property tax (assessor values × certified mill levy).
- Moderate confidence Specific Ownership Tax (SOT) estimated proportionally.
- Lower confidence EMS transport revenue (depends on transports, payer mix, collections, deployment).
This model is designed so that the directional conclusion does not depend on EMS precision, because property tax is the dominant revenue stream.
1. Property Tax (Mechanically Derived; Highest Confidence)
Data source: Boulder County Assessor parcel export (parcel-level assessed values) for all parcels located within the defined Station 4 / Zone 4 service boundary, plus MVFR’s adopted 2026 mill levy.
Method: Aggregate the assessed value of all included parcels, then apply the mill levy:
Property Tax Revenue = Total Assessed Value × (Mill Levy / 1,000)
Inputs (Zone 4):
| Total Assessed Value (Zone 4) | $326,119,505 |
| MVFR 2026 Mill Levy | 16.247 mills |
Calculation:
$326,119,505 × 0.016247 = $5,298,464 (rounded)
Reproducibility and verification: The underlying parcel list and assessed-value roll-up can be made available for independent verification. Because this is a mechanical calculation, any differences in results generally reflect one of the following: boundary definition differences, assessor export timing, exemptions, abatements, delinquencies, or post-certification corrections.
Limitations: This calculation estimates gross levy proceeds attributable to the Zone 4 tax base. It does not attempt to model county collection timing, delinquency, abatements, or district-level accounting treatments.
2. Specific Ownership Tax (SOT) (Allocated Estimate; Moderate Confidence)
Context: Colorado’s Specific Ownership Tax (SOT) is a vehicle ownership tax collected at registration and distributed to local governments through statutory formulas; it is commonly budgeted alongside property tax revenues. Because MVFR does not publish SOT receipts at the station/zone level, Zone 4’s share must be estimated.
District-level input (MVFR 2026 adopted):
| MVFR SOT Estimate | $1,886,827 |
| MVFR Total Property Tax (districtwide) | $47,154,314 |
Zone 4 allocation approach (proportional to property-tax share):
1. Compute Zone 4 share of district property tax base:
| Zone 4 Property Tax (derived above) | $5,298,464 |
| District Property Tax (MVFR) | $47,154,314 |
| Zone 4 Share | $5,298,464 / $47,154,314 = approx. 11.24% |
2. Apply that share to total district SOT:
$1,886,827 × 11.24% = approximately $212,100 (rounded to approximately $212,000)
Why this method: It is a transparent, conservative proportional approach that ties Zone 4’s estimated SOT to the same tax-base share used for property tax, while acknowledging that actual statutory distributions may not match a strict proportional allocation.
Limitations: Actual SOT receipts attributable to a given area can vary due to statutory distribution mechanics, county-level factors, and any changes in district boundaries or governance structure. This analysis treats the SOT figure as an estimate suitable for order-of-magnitude planning and sensitivity testing—not as a guaranteed revenue entitlement. SOT represents approximately 3.7% of the Zone 4 revenue baseline; therefore, even a complete loss of SOT would not alter the directional conclusions of this model across the modeled staffing range (see Appendix D).
3. Ambulance Transport Revenue (EMS) (Estimated; Lowest Confidence)
Context: Unlike property tax, EMS transport revenue is not tied to assessed valuation. It depends on: transport volume, deployment patterns, billing practices, payer mix, collection rates, contractual adjustments, and whether a transporting unit is continuously staffed in the service area.
District-level input (MVFR 2026 adopted):
| MVFR EMS Revenue Estimate | $1,420,000 |
Station-level allocation challenge: MVFR’s published materials do not provide station-level transports, station-level EMS billing, or station-level collections. Accordingly, this analysis cannot precisely assign the districtwide EMS revenue figure to Zone 4 without additional disclosure from MVFR.
Reasonable bounding methods:
Low-bound (call-volume proportional): If Zone 4 accounts for approximately 5.1% of total district call volume (as reported in MVFR planning materials), then a strict proportional allocation would imply: $1,420,000 × 5.1% = approximately $72,000.
Transport-adjusted reality: Call-volume share is not the same as transport share. A station can have a lower share of total calls but a higher share of transports (or vice versa), depending on incident mix, transport protocols, and unit posting strategy. Because Station 4 is reported in MVFR planning materials as staffing a 24/7 transporting ambulance, it is plausible that its transport-related collections exceed a strict call-proportional allocation—but the magnitude cannot be confirmed from publicly reported data.
Treatment in this model: For scenario modeling, this analysis uses a placeholder Zone 4 EMS estimate of approximately $200,000, explicitly disclosed as an assumption and treated as a sensitivity variable rather than a guaranteed entitlement (see Appendix D for alternate cases including $0 and $72,000).
Recommended sensitivity disclosure: Readers should interpret EMS revenue as a variable and consider alternative assumptions (e.g., $0, $72k, $200k) without changing the directional conclusions of the cost model at all but the highest modeled staffing level (because property tax dominates the revenue base). See Appendix D for a revenue sensitivity table.
4. Note on 2025 vs. 2026 EMS Revenue (Non-Recurring / Uncertain Funding)
MVFR’s 2026 Budget Book states that the District has participated in the Colorado EMS Supplemental Payment Program since 2022. In 2025, this program generated approximately $2.2 million in additional revenue. The adopted 2026 budget excludes this program revenue due to uncertainty regarding continued federal matching-fund availability, and the 2026 EMS projection reflects transport fees only. This is why EMS revenue is treated as sensitivity-only in this model and does not drive conclusions.
Interpretation: This model uses the adopted 2026 EMS revenue baseline intentionally to avoid overstating recurring capacity. If supplemental program revenue were to recur, it would improve the margin; if it does not recur, relying on the 2025 level would overstate sustainable revenue.
5. Transparency Commitments
Parcel roll-up transparency: The Zone 4 assessed value total is derived from a parcel-level dataset and can be replicated from Appendix C.
Allocated estimates clearly labeled: SOT and EMS figures are disclosed as estimates derived from transparent methods and conservative assumptions. If MVFR provides station-level revenue reporting in the future (or via records request), these figures can be mechanically updated without changing the model structure.
Revenue Summary (2026 Estimates)
Two geographic scopes are presented to establish a revenue range. The narrower “Niwot Only” figure reflects the incorporated community alone; the broader “Station 4 Area” figure reflects the full service territory. See Appendix C for parcel-level detail and Appendix D for revenue sensitivity analysis.
| Area | Property Tax | SOT | Ambulance | Total Revenue | Population | Per Resident |
|---|---|---|---|---|---|---|
| Niwot Only | $3.12M | $140K | $110K | ~$3.4M | 4,300 | $760 |
| Station 4 Area | $5.30M | $212K | $200K | ~$5.7M | 7,958 | $716 |
Zone 4 Tax-Base Revenue Estimate (2026)
The scenarios in Section IV use the Station 4 Area total of $5,710,000 (rounded from $5,710,464) as the revenue baseline. This figure includes property tax ($5,298,464), Specific Ownership Tax (approximately $212,000), and ambulance transport revenue (approximately $200,000). The 2026 baseline uses transport fees only; EMS Supplemental Payment Program revenue is excluded (see Section II.A.4).
It is important to note that SOT allocation formulas and ambulance transport revenue are subject to change and could be challenged as revenue sources in any restructuring scenario. For transparency:
- Property tax ($5,298,000) represents the most durable revenue stream, tied directly to assessed valuation within the service area.
- Specific Ownership Tax ($212,000) is allocated by formula and could shift under a new district structure.
- Ambulance transport revenue ($200,000) is contingent on continued operation of a transporting unit and payer mix.
A conservative analysis using property tax alone ($5,298,000) would reduce margins in all scenarios but would not change the directional conclusions across the modeled staffing range.
For reference, Boulder Rural’s 2026 adopted budget shows total tax revenue of $6,236,877 (property tax $6,036,877 + specific ownership tax $200,000).
III. Cost Benchmark Derivations
This section establishes the per-unit costs used in the operating scenarios that follow. Each benchmark is derived mechanically from the Mountain View 2026 Budget Book and the Boulder Rural 2026 Adopted Budget. Detailed line-item breakdowns are provided in Appendix A (Mountain View) and Appendix B (Boulder Rural).
III.1. Labor Cost per FTE
| Mountain View | Boulder Rural | |
|---|---|---|
| Total Personnel Expenditure | $41,957,683 | $5,534,020 |
| Total FTEs | 208.0 | 25.0 |
| Cost per FTE | $201,719 | $221,361 |
| Difference | $19,642 (9.7%) | |
Mountain View source: 2026 Budget Book, Page 20 (“General Fund by Object”) & Page 15 (“District Personnel History,” showing Total FTE of 208.00 for 2025). Boulder Rural source: 2026 Adopted Budget, Page 5 (“Statement of Revenues & Expenditures”).
Boulder Rural’s per-FTE labor cost is approximately 10% higher than Mountain View’s. Boulder Rural’s 2026 budget reflects a 31% year-over-year increase in personnel expenditure (up from $4.2M in 2025), which—combined with a smaller FTE denominator—produces the higher per-FTE figure.
Mountain View FTE denominator used: 208.0 (per the District’s 2026 Budget presented to the Board of Directors, Dec. 9, 2025, Page 15 “District Personnel History”). If the District asserts a different adopted FTE total for 2026, the per-FTE benchmarks adjust mechanically; scenario results change modestly, but directional conclusions are unchanged.
Note: Mountain View’s 2026 budget incorporates a retroactive adjustment to 2025 wages in addition to the scheduled 2026 increase, which the budget text states “results in personnel costs appearing elevated for a single year.” The per-FTE labor cost used in this model may therefore represent a high-side estimate relative to steady-state levels.
III.1.a. Station 4 Staffing-Cost Anchor (Public Statement; Not a Staffing-Count Claim)
Public Statement (Station 4 staffing cost): In a Feb. 4, 2026 Left Hand Valley Courier article, MVFR’s public information officer stated that “annual staffing costs at Station 4… are around $2.5 million,” and clarified that this figure does not include maintenance expenses. This is a public estimate, not audited station accounting.
Model implication: Using MVFR’s districtwide fully-loaded labor benchmark (approximately $201,719 per FTE), $2.5M corresponds to roughly 12–13 fully-loaded FTE-equivalents (depending on allocation definitions). This comparison is presented solely as a scale cross-check and does not imply that Station 4 is currently staffed at 12 FTEs. This aligns closely with the model’s 12 FTE labor case ($2.42M), and is therefore used as a reasonableness anchor for the low end of the staffing sensitivity range.
Important limitation: The term “staffing cost” in public statements may reflect a station allocation methodology that differs from districtwide fully-loaded cost per FTE. Accordingly, this figure is used as a cross-check, not as a definitive staffing-count determination.
Revenue context: This indicates that Zone 4 revenue materially exceeds the station’s publicly stated staffing-cost allocation, with the difference supporting district-wide administrative, capital, reserve, and system-level functions within the pooled district budget. Station-level maintenance, district overhead, capital replacement, reserves, and system-wide coverage are not included in that staffing-cost figure. This comparison is presented as a reasonableness cross-check only; it does not imply that the publicly stated staffing figure reflects a fully-loaded cost allocation methodology.
III.2. Support / Admin / Prevention Allocation per FTE
To ensure an apples-to-apples comparison, support, administrative, and prevention overhead is allocated on a per-FTE basis in both districts—representing the organizational support cost per staffed position.
| Mountain View | Boulder Rural | |
|---|---|---|
| Support / Admin / Prevention Expenditure | $11,059,524 | $543,688 |
| Total District FTEs | 208.0 | 25.0 |
| Cost per FTE | $53,175 | $21,748 |
Support / Admin / Prevention Cost per FTE
Mountain View source: 2026 Budget Book, “Budget by Department” (Pages 46–64). Boulder Rural source: 2026 Adopted Budget, Page 5.
Mountain View’s allocation includes six support departments (Administration, Communications, Technology, Human Resources, Finance, and Life Safety/Prevention). MVFR classifies prevention/life-safety as a department-level function; some agencies treat portions of this as operations rather than overhead. The inclusion of Life Safety/Prevention in the administrative bucket reflects MVFR’s own organizational structure and budget classification. Boulder Rural’s figure reflects Administration only; Office Expense ($127,765) is classified as station-level operational cost rather than executive overhead, consistent with the district’s own budget language, which describes the non-personnel remainder as “administration, and operational expenses.”
The per-FTE support/admin/prevention cost in Mountain View ($53,175) is approximately 2.4 times the Boulder Rural figure ($21,748). The higher Mountain View per-FTE allocation may reflect districtwide service breadth, communications infrastructure, prevention programming, and scale-related complexity beyond a district whose adopted budget presents all non-personnel operating costs as a single staffed-operations bucket.
Mountain View FTE denominator used: 208.0 (per the District’s 2026 Budget presented to the Board of Directors, Dec. 9, 2025, Page 15 “District Personnel History”). Boulder Rural FTE denominator used: 25.0 (confirmed via written communication from BRFPD Chief, Feb. 2026).
For context, these per-FTE figures correspond to rates of 21.0% of the Mountain View General Fund and 9.8% of Boulder Rural Personnel Services, respectively. The per-FTE allocation method is used in the scenarios below because it scales cost directly with headcount, making scenario comparisons consistent regardless of differences in how each district structures its budget denominator.
Administrative costs do not scale perfectly linearly with staffing; however, per-FTE allocation is used here as a conservative simplification to compare organizational efficiency under different staffing configurations. In practice, a smaller operation may require a higher per-FTE administrative allocation (due to fixed costs such as legal, audit, and insurance), while a larger organization may achieve economies of scale. This model does not attempt to predict the specific administrative cost structure of a hypothetical new arrangement.
Note: Boulder Rural’s 2026 adopted budget includes an $864,111 transfer from reserves “in order to meet the District’s expected expenses,” with a projected ($839,381) change in fund balance for 2026. The benchmarks used in this analysis reflect adopted spending levels, not necessarily long-run steady-state expenditures funded solely by recurring revenues. This should be considered when evaluating the durability of Boulder Rural’s cost structure as a benchmark.
III.3. Station Operations (OpEx) — Classification Differences & Sensitivity Framework
Per-station comparisons here are classification-sensitive; they are used only to bound a range and should not be read as an “efficiency” measure.
| Mountain View | Boulder Rural | |
|---|---|---|
| Station/Operations Budget | $1,573,746 | $1,080,990 |
| Staffed-Operations Denominator | 10 | 1* |
| Cost per Station | $157,374 | $1,080,990 |
The term “Station Operations” is not defined consistently across districts. Mountain View’s “Stations & Grounds” department (Dept 800) primarily reflects facilities and grounds costs. Boulder Rural’s “Office, Operations, and Training” subtotal captures the district’s full non-personnel, non-administrative operating expenditure. Because these categories differ in scope and denominator, direct per-station comparison must be treated cautiously. Accordingly, this analysis treats station OpEx as a bounded range rather than a single benchmark. In a district whose budget presents operating costs as a single undivided subtotal, many district-wide operating functions will appear in that bucket by necessity, inflating per-station comparisons relative to a multi-station district where those costs are spread or categorized differently.
Mountain View source: 2026 Budget Book, Page 68 (“Stations and Grounds — Dept 800”). Boulder Rural source: 2026 Adopted Budget, Page 5.
Note on Mountain View station count: The divisor of 10 reflects the District’s 10 staffed, strategically located fire stations as described in the budget book. The District also maintains Station 13 (North Battalion Chief response station) and two storage-only facilities, which are not staffed operational stations and are excluded from the per-station calculation.
Boulder Rural’s 2026 adopted budget presents all non-personnel, non-admin operating costs as a single “Office/Operations/Training” subtotal associated with its staffed operations. This analysis treats that subtotal as a single staffed-operations bucket benchmark—not a claim about the number of physical facilities. This classification places all non-administrative, non-personnel operational spending at the station level.
*Boulder Rural denominator of 1 reflects the budget’s presentation of operating costs as a single undivided subtotal, not an assertion about physical station count.
Facility clarification (Chief statement): The Boulder Rural Fire Chief has stated that the District operates one staffed station, and that an additional building referenced in some filings is used primarily for storage/support functions, not as a separately staffed operational station. This analysis therefore uses Boulder Rural’s adopted budget presentation as a single staffed-operations bucket benchmark and does not rely on facility count.
Station OpEx Range Used in This Model
| Case | Station OpEx | Basis |
|---|---|---|
| Low Case (Facilities Proxy) | $157,374 | Mountain View “Stations & Grounds” allocation |
| Mid Case (Localized Build-Up Estimate) | $330,000 | Component-based estimate for Station 4 footprint |
| High Case (Full District Non-Personnel Allocation) | $1,080,990 | Boulder Rural total non-personnel operating cost (single staffed-operations bucket per adopted budget) |
The mid-case ($330,000) is treated as a mid-case point estimate (component build-up) for Scenario 3. The low and high cases serve as bounding conditions for sensitivity testing.
The localized mid-case estimate of $330,000 is a component-based operating build-up calibrated to Station 4’s reported apparatus footprint (engine company + transporting ambulance), using the published 2026 budget structures as bounding references. This estimate includes facility utilities and maintenance (approximately $170k), fleet fuel and repair for two front-line apparatus (approximately $65k), crew PPE and uniforms (approximately $60k), and medical/EMS supplies (approximately $35k).
The $330,000 mid-case is intentionally modeled as a marginal, station-local operating cost rather than a full replication of a district’s total non-personnel operating budget. It includes facility utilities and routine maintenance, apparatus fuel and repair for two front-line units (engine + transporting ambulance), crew PPE and uniform replacement, and EMS consumable supplies. It excludes districtwide system costs that may appear within a district’s “station” bucket due to classification structure. Examples of excluded system costs include districtwide training administration, command support, shared logistics/procurement, district IT systems, district-wide insurance/audit/legal, and other central functions that may be classified as “station operations” in a district with a single staffed-operations budget bucket. The $330,000 mid-case estimate reflects a marginal station-local operating range of approximately $300,000–$400,000, with $330,000 used as the midpoint point estimate, computed as the sum of the midpoints of each component range.
Station 4 Marginal OpEx Build-Up (Mid-Case)
| Component | Rationale | Estimated Range |
|---|---|---|
| Facility utilities & routine maintenance | Station-specific facility cost | $150,000–$190,000 |
| Apparatus fuel & repair (engine + medic) | Unit-specific operating cost | $50,000–$80,000 |
| PPE & uniforms | Crew-specific replacement cycle | $40,000–$80,000 |
| EMS medical supplies | Transport-specific consumables | $20,000–$50,000 |
| Mid-case point estimate | $330,000 |
MVFR’s adopted budget includes material districtwide line items in the same object categories represented in this build-up (fuel, fleet expense, training, utilities/data services, EMS supplies, uniforms/allowances). Because MVFR does not publish station-level splits, this model uses a bounded station-local estimate rather than asserting a precise audited Station 4 allocation.
Ranges reflect the difference between MVFR’s facilities-only proxy ($157,374) and Boulder Rural’s broader non-personnel allocation; $330,000 is a mid-case point estimate built from station-local components (utilities/maintenance, fleet consumables, PPE/uniform replacement, EMS consumables). It is not a mathematical midpoint of the low/high benchmarks; it is a planning estimate inside a $300k–$400k station-local band. For reference, $330,000 is approximately 2.1× MVFR’s facilities proxy ($157,374) and approximately 31% of Boulder Rural’s full non-personnel operating subtotal ($1,080,990), consistent with a “marginal station-local” interpretation bounded by the two published structures.
In a district whose budget presents all non-personnel operating costs as a single undivided subtotal, many districtwide operating functions are embedded within that subtotal by necessity. If operations were scaled across multiple staffed stations, a portion of those costs would become shared rather than duplicated. Accordingly, Boulder Rural’s current $1,080,990 should be interpreted as a full-district non-personnel operating total, not as the expected marginal operating cost of any single station within a multi-station structure.
III.4. Capital Replacement & Lifecycle Reserve (Policy Target)
| Mountain View | Boulder Rural | |
|---|---|---|
| District-Wide Capital Budget | $5,000,000 | $561,000 |
| Staffed-Operations Denominator | 10 | 1* |
| Per-Station Allocation | $500,000 | $561,000 |
Mountain View source: 2026 Budget Book, Page 14 (“Capital Purchases”). Boulder Rural source: 2026 Adopted Budget, Page 5.
Mountain View’s budget documentation states that “$5 million is needed each year to ensure funds are available for routine replacement of current assets when required.” All three scenarios below adopt the $500,000 per-station figure as a conservative baseline to ensure full capital sustainability.
This reserve target is intended to cover fleet and major equipment lifecycle replacement. Facilities capital (e.g., station renovation or replacement) may be incremental depending on station condition and is not separately modeled here.
IV. Operating Cost Scenarios
The following scenarios apply the benchmarks from Section III to Zone 4 tax-base revenue of $5,710,000 across four staffing configurations. All three scenarios hold the capital replacement and lifecycle reserve constant at $500,000. Support/admin/prevention overhead is allocated per FTE in all scenarios using the same methodology.
These scenarios are presented as cost benchmarks, not as proposals. Each reflects a different set of verifiable unit costs applied to the same revenue and staffing assumptions.
Scenario 1: Mountain View Benchmark
Uses Mountain View cost rates: $201,719/FTE labor, $53,175/FTE support/admin/prevention, $157,374 station OpEx.
| Line Item | 12 FTE | 15 FTE | 18 FTE | 21 FTE |
|---|---|---|---|---|
| Zone 4 Tax-Base Revenue | $5,710,000 | $5,710,000 | $5,710,000 | $5,710,000 |
| EXPENSES | ||||
| Labor (@$201,719/FTE) | ($2,420,628) | ($3,025,785) | ($3,630,942) | ($4,236,099) |
| Support/Admin/Prevention (@$53,175/FTE) | ($638,100) | ($797,625) | ($957,150) | ($1,116,675) |
| Station OpEx | ($157,374) | ($157,374) | ($157,374) | ($157,374) |
| Capital Replacement & Lifecycle Reserve | ($500,000) | ($500,000) | ($500,000) | ($500,000) |
| Total Expense | ($3,716,102) | ($4,480,784) | ($5,245,466) | ($6,010,148) |
| Net Position | $1,993,898 | $1,229,216 | $464,534 | ($300,148) |
Scenario 2: Boulder Rural Benchmark
Uses Boulder Rural cost rates: $221,361/FTE labor, $21,748/FTE support/admin/prevention, $1,080,990 station OpEx.
| Line Item | 12 FTE | 15 FTE | 18 FTE | 21 FTE |
|---|---|---|---|---|
| Zone 4 Tax-Base Revenue | $5,710,000 | $5,710,000 | $5,710,000 | $5,710,000 |
| EXPENSES | ||||
| Labor (@$221,361/FTE) | ($2,656,332) | ($3,320,415) | ($3,984,498) | ($4,648,581) |
| Support/Admin/Prevention (@$21,748/FTE) | ($260,976) | ($326,220) | ($391,464) | ($456,708) |
| Station OpEx | ($1,080,990) | ($1,080,990) | ($1,080,990) | ($1,080,990) |
| Capital Replacement & Lifecycle Reserve | ($500,000) | ($500,000) | ($500,000) | ($500,000) |
| Total Expense | ($4,498,298) | ($5,227,625) | ($5,956,952) | ($6,686,279) |
| Net Position | $1,211,702 | $482,375 | ($246,952) | ($976,279) |
Scenario 3: Hybrid Localized Model (Boulder Rural labor/admin + marginal station-local OpEx)
Uses Boulder Rural labor and support/admin/prevention rates with a localized Station 4 OpEx estimate: $221,361/FTE labor, $21,748/FTE support/admin/prevention, $330,000 station OpEx. This scenario is not intended to represent Boulder Rural’s current structure, but to illustrate how Zone 4 revenue performs under a marginal, station-local cost interpretation within a multi-station framework.
| Line Item | 12 FTE | 15 FTE | 18 FTE | 21 FTE |
|---|---|---|---|---|
| Zone 4 Tax-Base Revenue | $5,710,000 | $5,710,000 | $5,710,000 | $5,710,000 |
| EXPENSES | ||||
| Labor (@$221,361/FTE) | ($2,656,332) | ($3,320,415) | ($3,984,498) | ($4,648,581) |
| Support/Admin/Prevention (@$21,748/FTE) | ($260,976) | ($326,220) | ($391,464) | ($456,708) |
| Station OpEx (Marginal / Station-Local) | ($330,000) | ($330,000) | ($330,000) | ($330,000) |
| Capital Replacement & Lifecycle Reserve | ($500,000) | ($500,000) | ($500,000) | ($500,000) |
| Total Expense | ($3,747,308) | ($4,476,635) | ($5,205,962) | ($5,935,289) |
| Net Position | $1,962,692 | $1,233,365 | $504,038 | ($225,289) |
Net Position Comparison Across Scenarios
| Scenario | 12 FTE | 15 FTE | 18 FTE | 21 FTE |
|---|---|---|---|---|
| 1 — Mountain View Benchmark | $1,993,898 | $1,229,216 | $464,534 | ($300,148) |
| 2 — Boulder Rural Benchmark | $1,211,702 | $482,375 | ($246,952) | ($976,279) |
| 3 — Hybrid Localized Model | $1,962,692 | $1,233,365 | $504,038 | ($225,289) |
OpEx Sensitivity Across Staffing Levels (Boulder Rural Labor/Admin Rates)
Holding labor ($221,361/FTE), support/admin/prevention ($21,748/FTE), and capital replacement ($500,000) constant at Boulder Rural rates, the following table isolates the effect of station OpEx assumptions on net position across all four staffing configurations:
| Station OpEx Assumption | 12 FTE | 15 FTE | 18 FTE | 21 FTE |
|---|---|---|---|---|
| $157,374 (Low — Facilities Proxy) | $2,135,318 | $1,405,991 | $676,664 | ($52,663) |
| $330,000 (Mid — Localized Build-Up) | $1,962,692 | $1,233,365 | $504,038 | ($225,289) |
| $1,080,990 (High — Full District Allocation) | $1,211,702 | $482,375 | ($246,952) | ($976,279) |
At 18 FTEs, the $923,616 swing between low and high cases illustrates that station OpEx classification—not labor or administrative costs—is the primary driver determining whether that configuration produces a surplus or deficit. At 21 FTEs, all three OpEx assumptions produce negative net positions, confirming that staffing cost dominates at higher headcounts regardless of station OpEx treatment.
Net Position by Staffing Level
Expense Breakdown at 18 FTE
V. Observations
- Labor cost divergence. Boulder Rural’s per-FTE labor cost ($221,361) is approximately 10% higher than Mountain View’s ($201,719), reflecting both Boulder Rural’s 31% year-over-year personnel spending increase and a smaller FTE denominator. This labor cost gap, combined with administrative and station OpEx differences, drives the spread between scenarios.
- Support/admin/prevention allocation. Mountain View’s per-FTE support/admin/prevention cost ($53,175) is approximately 2.4 times Boulder Rural’s ($21,748). This difference remains a significant structural variable between scenarios. For reference, these correspond to rates of 21.0% of the Mountain View General Fund and 9.8% of Boulder Rural Personnel Services, respectively. These costs do not scale perfectly linearly with headcount; the per-FTE method is a simplification used to enable consistent comparison.
- Staffing sensitivity. All three scenarios produce a positive net position at 15 FTEs or fewer, assuming those staffing levels are operationally sufficient. At 18 FTEs, Scenarios 1 (Mountain View) and 3 (Hybrid) remain positive, while Scenario 2 (Boulder Rural) turns negative due to its higher adopted non-personnel operating subtotal (as presented in the Boulder Rural budget). At 21 FTEs, all three scenarios produce negative net positions.
- Margin variability. At the 15 FTE configuration, the net position ranges from $482,375 (Scenario 2) to $1,233,365 (Scenario 3)—a spread of $750,990 driven by differences in per-FTE labor cost, support/admin/prevention allocation, and station operating cost assumptions. At 18 FTEs, Scenario 2 produces a deficit of ($246,952) while Scenario 3 retains a $504,038 surplus.
- Station OpEx classification. District-reported “station” line items vary significantly ($157,374 vs. $1,080,990) due to classification structure and denominator effects rather than necessarily reflecting operational disparity. For that reason, this model presents station OpEx as a sensitivity range rather than a single benchmark. The localized $330,000 estimate represents a mid-case station-local operating estimate specific to Station 4’s reported apparatus footprint.
- Revenue composition. The $5,710,000 revenue baseline includes property tax ($5,298,000), SOT (approximately $212,000), and ambulance transport revenue (approximately $200,000). Property tax alone represents approximately 93% of the revenue baseline and is the dominant and most durable component. A property-tax-only analysis ($5,298,000) would reduce margins in all scenarios but would not change directional conclusions at all but the highest modeled staffing level.
- Benchmark sustainability. Boulder Rural’s 2026 budget relies in part on a reserve draw ($864,111) to meet planned expenditures. While the per-unit cost figures derived from that budget are internally consistent, they reflect a spending level that exceeds recurring revenue in the current fiscal year. Mountain View’s 2026 per-FTE labor cost may be elevated due to a one-time retroactive wage adjustment. Both factors should be weighed when evaluating the long-term representativeness of either district’s 2026 benchmarks.
- Pooled budgeting and shared services. Multi-station fire districts pool revenue and fund shared capabilities districtwide. Differences between Zone 4 revenue and localized Station 4 line items are therefore not, by themselves, evidence of a problem; they reflect how shared services, reserves, capital programs, and system-wide coverage depth are financed. This model illustrates the fiscal effect of different, verifiable unit-cost structures without assigning intent or policy judgment.
VI. Sensitivity & Risk Factors
This model relies on several assumptions that carry inherent uncertainty. The following factors should be evaluated in any further due diligence process.
FTE Uncertainty. The model presents four staffing levels but does not determine the operationally correct FTE count. Minimum staffing requirements are subject to NFPA guidelines, ISO rating considerations, and call volume analysis. An independent staffing study would be required to establish the appropriate FTE level for Zone 4.
Revenue Durability. The revenue baseline of $5,710,000 includes three components with different risk profiles. Property tax revenue ($5,298,000) is the most stable, tied to assessed valuations and mill levy rates. SOT allocation (approximately $212,000) is formula-driven and could change under a new district structure. Ambulance transport revenue (approximately $200,000) is contingent on payer mix, collection rates, and continued operation of a transporting unit. A conservative stress test using property tax revenue alone should be considered. Mill levy compression, assessed value appeals, or legislative changes affecting special district taxation could also alter property tax projections.
Call Volume Risk. Operating costs are sensitive to call volume. Higher-than-projected call volumes could increase overtime, supply consumption, and apparatus wear, narrowing the projected margin.
Capital Cost Volatility. The $500,000 annual capital replacement and lifecycle reserve is based on Mountain View’s current fleet replacement methodology. Actual apparatus costs have escalated significantly in recent years. A dedicated capital needs assessment for Station 4’s specific apparatus inventory would refine this estimate. Facilities capital (station renovation or replacement) is not included in this reserve target and may require separate funding.
Pension Cost Variability. Firefighter pension obligations (FPPA) are included in the per-FTE labor cost at current contribution rates. Future changes to FPPA contribution requirements or unfunded liability assessments could increase the per-FTE cost above the $201,719–$221,361 range modeled here.
Administrative Scaling. The per-FTE support/admin/prevention allocation method used in this model assumes linear scaling. In practice, these costs include both fixed components (legal, audit, insurance, executive compensation) and variable components (HR processing, IT support). A smaller operation may require a higher per-FTE allocation due to fixed-cost indivisibility, while a larger organization may achieve economies of scale. The actual cost of any specific partnership arrangement would need to be negotiated and documented.
Prevention Classification. Mountain View’s support/admin/prevention bucket includes Life Safety/Prevention ($1,074,053), which some agencies classify as an operational function rather than overhead. If prevention were reclassified as operations, Mountain View’s per-FTE administrative figure would decrease and the gap between districts would narrow. This model uses MVFR’s own departmental classification.
Insurance and ISO Rating. A change in administrative structure could affect the district’s ISO Public Protection Classification, which in turn affects homeowner insurance premiums within the service area. Any transition plan should include an ISO impact assessment to ensure no adverse rating change.
Mutual Aid Dependencies. As a station within MVFR, Station 4 is covered by the district’s existing mutual aid agreements. An alternative administrative arrangement would require formal mutual aid agreements (IGAs) with neighboring jurisdictions to maintain response depth for major incidents.
Transition Costs. This model reflects steady-state operating costs and does not account for one-time transition expenses such as legal fees, equipment transfers, system integration, or interim service agreements that would be incurred during any administrative change.
Benchmark Year Representativeness. Both districts’ 2026 budgets contain elements that may not be representative of steady-state operations. Mountain View’s personnel costs include a retroactive wage adjustment described as causing costs to “appear elevated for a single year.” Boulder Rural’s budget includes an $864,111 reserve transfer to balance expenditures, with a projected ($839,381) change in fund balance. Multi-year trend analysis would improve confidence in benchmark durability.
Station Allocation Ambiguity. MVFR’s publicly reported Station 4 staffing cost (approximately $2.5M) excludes maintenance and may not reflect the fully-loaded labor allocation methodology used in this analysis. Accordingly, this analysis models both (a) district-average fully-loaded benchmarks and (b) the publicly stated station staffing figure as a reasonableness anchor. The actual cost allocation to Station 4 within MVFR’s internal accounting may differ from either approach.
VII. Conclusion
Based on the modeling above, Zone 4 tax-base revenue is sufficient under multiple verifiable cost benchmarks to cover fully-loaded station costs—including staffing, operations, and capital lifecycle reserves—at modeled staffing levels of 15 FTEs or fewer. At 18 FTEs, two of three benchmarks remain positive; at 21 FTEs, all three produce negative net positions.
The primary structural differences between scenarios are per-FTE labor cost, support/admin/prevention allocation, and station operating cost classification. Because districts define “station operations” differently, this analysis presents station OpEx as a bounded sensitivity range rather than a single benchmark. Configurations that align Zone 4 revenue with localized operating costs demonstrate a wider fiscal margin under the assumptions modeled here. The Hybrid Localized Model does not assume that Boulder Rural would currently provide services at the marginal station-local OpEx level; rather, it models what the station-local operating cost would be under a multi-station structure where districtwide system costs are allocated separately.
The purpose of this analysis is not to assert a single definitive station cost, but to test whether Zone 4 revenue can sustain service levels under multiple plausible cost structures. The model is structured so that updated or corrected inputs can be substituted without altering its methodology or overall framework.
This analysis does not determine the optimal governance structure, nor does it evaluate qualitative factors such as culture, service philosophy, response integration, or community identity. It strictly tests revenue sufficiency under verifiable cost benchmarks.
These findings are based on publicly available budget data (Boulder Rural 2026 Adopted Budget) and board-distributed budget documentation (Mountain View 2026 Budget Book), using standardized cost allocation methods. Further due diligence—including an independent staffing study, capital needs assessment, ISO impact analysis, and intergovernmental dialogue—would be required prior to any policy action.
VIII. Due Diligence Checklist (Nonbinding)
This document is a cost model. It is not a proposal to restructure fire service delivery, and no immediate change in administrative arrangements is being sought.
The purpose of publishing this analysis is to ensure that residents of the Station 4 service area have access to transparent, verifiable cost information as they evaluate the fiscal implications of incorporation and governance options.
Should incorporation proceed, the following steps would be appropriate before any policy action regarding fire service:
- Independent staffing study to determine the operationally correct FTE level for Zone 4, consistent with NFPA standards and ISO requirements.
- Capital needs assessment specific to Station 4’s apparatus inventory and facility condition.
- ISO impact analysis to confirm that any administrative change would not adversely affect the area’s Public Protection Classification.
- Intergovernmental dialogue with Mountain View Fire Protection District, Boulder Rural Fire Protection District, and other neighboring agencies to explore partnership structures, mutual aid agreements, and transition terms.
- Legal review of statutory requirements for special district formation, exclusion, or inclusion under Colorado Revised Statutes.
The cost benchmarks in this document provide a factual foundation for those conversations. They do not predetermine the outcome.
Appendix A: Mountain View Fire Protection District — Cost Derivations
All figures derived from the Mountain View Fire Protection District 2026 Budget Book (board packet / hard-copy distribution; not publicly available online as of the date of this analysis). Total General Fund expenditures: $52,650,166. Page references are provided for verification against that document.
A.1. Labor Cost: $201,719 per FTE
Source: 2026 Budget Book, Page 20 (“General Fund by Object”) & Page 15 (“District Personnel History,” showing Total FTE of 208.00).
| Line Item | Amount |
|---|---|
| Total Salaries & Wages | $28,172,884 |
| Total Overtime | $2,638,706 |
| Total Benefits | $11,146,093 |
| Total Personnel Cost | $41,957,683 |
| Total District FTEs | 208.0 |
$41,957,683 / 208 FTEs = $201,719 per FTE
Note: The 2026 budget incorporates a retroactive adjustment to 2025 wages plus the scheduled 2026 increase, which the budget text states “results in personnel costs appearing elevated for a single year.” This per-FTE figure may therefore represent a high-side estimate relative to steady-state levels.
A.2. Support / Admin / Prevention: $53,175 per FTE
Source: 2026 Budget Book, “Budget by Department” (Pages 46–64).
| Department | Dept Code | Budget |
|---|---|---|
| Administration | 100 | $5,318,177 |
| Communications | 103 | $171,299 |
| Technology | 105 | $1,567,408 |
| Human Resources | 107 | $2,057,335 |
| Finance | 109 | $871,252 |
| Life Safety / Prevention | 300 | $1,074,053 |
| Total Support / Admin / Prevention | $11,059,524 |
| Total District FTEs | 208.0 |
$11,059,524 / 208 FTEs = $53,175 per FTE
For reference, this represents 21.0% of the $52,650,166 General Fund total.
Note: MVFR classifies Life Safety/Prevention as a department-level function. Some agencies treat portions of prevention as operations rather than overhead. This model uses MVFR’s own organizational classification.
A.3. Station Operations (OpEx): $157,374 per Station
Source: 2026 Budget Book, Page 68 (“Stations and Grounds — Dept 800”).
| Line Item | Amount |
|---|---|
| Dept 800 Total Budget | $1,573,746 |
| Staffed Station Count | 10 |
$1,573,746 / 10 Staffed Stations = $157,374 per Station
Note: The District operates 10 staffed, strategically located fire stations. Station 13 serves as the North Battalion Chief response station, and two additional facilities are used for storage only. These non-staffed facilities are excluded from the per-station calculation.
A.4. Capital Replacement & Lifecycle Reserve: $500,000 per Station per Year
Source: 2026 Budget Book, Page 14 (“Capital Purchases”).
The District’s budget documentation states: “On average, $5 million is needed each year to ensure funds are available for routine replacement of current assets when required.”
$5,000,000 / 10 Staffed Stations = $500,000 per Year
This reserve target covers fleet and major equipment lifecycle replacement. Facilities capital may be incremental depending on station condition.
Appendix B: Boulder Rural Fire Protection District — Cost Derivations
All figures derived from the Boulder Rural Fire Protection District 2026 Adopted Budget. The district’s 2026 adopted budget presents all non-personnel, non-admin operating costs as a single staffed-operations subtotal (not a claim about the number of physical facilities), with total expenditures of $7,719,698 ($7,158,698 operational, $561,000 capital outlay). Personnel services total $5,534,020. The remaining non-personnel operating expenditure of $1,125,863 is described in the budget message as “administration, and operational expenses.” Tax revenue totals $6,236,877 (property tax $6,036,877 + specific ownership tax $200,000).
Note: The 2026 adopted budget includes an $864,111 transfer from reserves “in order to meet the District’s expected expenses,” with a projected ($839,381) change in fund balance. The benchmarks below reflect adopted spending levels, not necessarily long-run steady-state expenditures funded solely by recurring revenues.
B.1. Labor Cost: $221,361 per FTE
Source: 2026 Adopted Budget, Page 5 (“Statement of Revenues & Expenditures”).
| Line Item | Amount |
|---|---|
| Total Personnel Services | $5,534,020 |
| (Up from $4.2M in 2025) | |
| FTE Count | 25.0¹ |
$5,534,020 / 25 FTEs = $221,361 per FTE
¹ 25 FTE confirmed via written communication from BRFPD Chief, Feb. 2026.
B.2. Administrative Overhead: $21,748 per FTE
Source: 2026 Adopted Budget, Page 5.
Administrative overhead is limited to the Administration line item. Office Expense is classified as station-level operational cost (see B.3), consistent with the budget’s own description of non-personnel spending as “administration, and operational expenses.”
| Administration | $543,688 |
| Total District FTEs | 25.0 |
$543,688 / 25 FTEs = $21,748 per FTE
For reference, this represents 9.8% of Personnel Services ($5,534,020).
B.3. Station Operations (OpEx): $1,080,990 (single staffed-operations bucket; per adopted budget presentation)
Source: 2026 Adopted Budget, Page 5.
Station-level operational costs include Office Expense, Operations, and Training—all non-administrative, non-personnel operating expenditure.
| Line Item | Amount |
|---|---|
| Office Expense | $127,765 |
| Operations | $582,175 |
| Training | $371,050 |
| Total Station OpEx | $1,080,990 |
$1,080,990 / 1 staffed-operations bucket = $1,080,990 per adopted budget presentation
Reconciliation check: Personnel ($5,534,020) + Administration ($543,688) + Station OpEx ($1,080,990) + Capital ($561,000) = $7,719,698, matching total district expenditures.
B.4. Capital Replacement: $561,000 (District Wide)
Source: 2026 Adopted Budget, Page 5.
| Line Item | Amount |
|---|---|
| Capital Expenditures | $561,000 |
All scenarios in this analysis adopt the more conservative $500,000 per-station figure derived from Mountain View’s capital methodology.
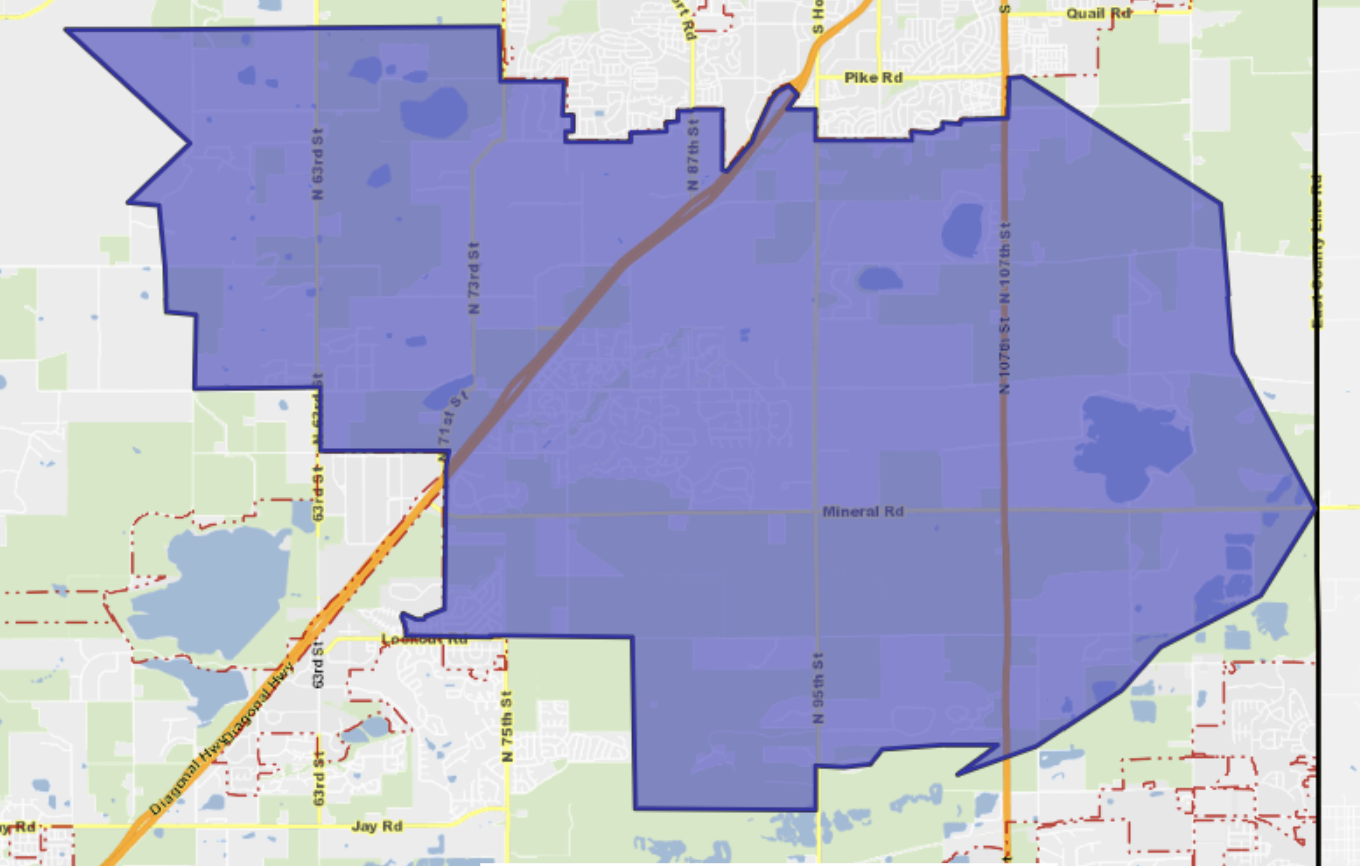
Appendix C: Zone 4 Parcel Roll-Up (Assessor Data)
Parcel Roll-Up Method & Quality Controls (Zone 4)
Because Zone 4 is not a separately reported fiscal entity, property-tax revenue was derived mechanically from parcel-level assessed values. Parcel records were reconciled using Boulder County parcel numbers and strap identifiers, with duplicate parcel entries removed prior to valuation aggregation. The original assessor parcel export contained 4,700 records; deduplication produced 3,969 unique parcel numbers. After linking parcels to strap-based valuation records, the integrated dataset contained 4,007 records, reflecting cases where a single parcel number corresponds to multiple tax straps.
Assessed-value fields were successfully matched for 3,872 of 4,007 integrated records (96.6%). The resulting roll-up identifies 3,663 taxable parcels with total taxable assessed value of $326,119,505, which is the basis for the Zone 4 property tax calculation in Section II.
Summary
| Component | Value |
|---|---|
| Original Assessor Export Records | 4,700 |
| Unique Parcel Numbers (after dedup) | 3,969 |
| Integrated Records (parcel + strap) | 4,007 |
| Successfully Matched (assessed value) | 3,872 (96.6%) |
| Taxable Parcels | 3,663 |
| Total Taxable Assessed Value | $326,119,505 |
| Mill Levy Applied | 16.247 mills |
| Calculated Property Tax | $5,298,464 |
Supporting Materials
Assessor Data Export (screenshot): Station 4 Area — Boulder County Assessor Export
Exported Dataset: Record-Export-Station-4.csv — Raw parcel-level export file used in this analysis. Includes parcel numbers, strap identifiers, assessed values, and boundary classification.
Boulder County Assessor Website: Additional datasets required to replicate this analysis (including strap-to-valuation linkage tables and parcel boundary data) are available from the Boulder County Assessor’s Office at bouldercounty.gov/departments/assessor.
Appendix D: Revenue Sensitivity Table (SOT + EMS)
This table shows Zone 4 total revenue under alternative EMS revenue assumptions, holding property tax and SOT constant. All figures rounded.
| Scenario | Property Tax | SOT | EMS | Total Revenue |
|---|---|---|---|---|
| EMS = $0 (property tax + SOT only) | $5,298,000 | $212,000 | $0 | $5,510,000 |
| EMS = $72k (call-volume proportional) | $5,298,000 | $212,000 | $72,000 | $5,582,000 |
| EMS = $200k (model baseline) | $5,298,000 | $212,000 | $200,000 | $5,710,000 |
Impact on Scenario 3 (Hybrid Localized Model) at 18 FTE:
Expenses held constant at $5,205,962; only revenue varies with EMS assumption.
| Revenue Assumption | Total Revenue | Total Expense | Net Position |
|---|---|---|---|
| EMS = $0 | $5,510,000 | ($5,205,962) | $304,038 |
| EMS = $72k | $5,582,000 | ($5,205,962) | $376,038 |
| EMS = $200k (baseline) | $5,710,000 | ($5,205,962) | $504,038 |
Scenario 3 Net Position at 18 FTE by EMS Assumption
Even under the most conservative revenue assumption (EMS = $0), the Hybrid Localized Model remains positive at 18 FTEs ($304,038). The directional conclusion is unchanged across the EMS range.